I am a Mathematician & Engineer by training and a Data Scientist in practice. What does a Data Scientist do? Put it simply, a Data Scientist blends Mathematics, Statistics, Computer Science and subject matter expertise to make sense of data. The role varies by industry, but the final goal of such a role is to help with a data-driven decision making process. The funny thing is that I got into it accidentally. I leave the story of how I got into it for later.
I have been digging into different datasets as part of my day job and also my side projects for a long time. Since pandemic I have got interested in datasets related to economy. In general, I have become more interested to understand how economy works (10,000 feet view), how money works, how Federal Reserve works, and many more “hows”. I spent 2020 reading about these subjects and looking at specific datasets.
One important subject that I came across, which is relatively known to people (and affects people’s life to a great extend), was inflation. For those who are not familiar with inflation, the inflation rate is the percentage increase or decrease in prices during a specified period. Why is this quantity important?
One line answer: high/low inflation can make or break an economy. For example, if inflation is really high, let’s say 10% per year, it means the same goods you buy today will be 10% more expensive next year. So you expect to pay more for the same goods next year. What you might think to do to overcome the inflation, at least temporarily, is to buy many of those goods (at least you will save money for sometime since the prices are expected to go up). Imagine others think the same way and they buy those goods too. The more demand (with a constant supply), the more the price of those goods. In other words, expectation of inflation itself creates more inflation. In this case, you might end up with 15% inflation.
Here is another issue with high inflation that affects you personally. If your wage does not go up with inflation, you become poorer and poorer as time goes by. There are many more reasons why high inflation is not good, but believe me you do not want high inflation. On the other hand, low inflation is not good either (and negative inflation which Japan experienced is even worse). If you know the price of a good is going to stay the same or to go down, would you buy it now? Maybe you do maybe you do not. Usually low inflation results in low consumption. Low consumption creates low growth economy plus other problems down the road.
For aforementioned reasons and many more, central banks set inflation target and try to stabilize the price of goods. In the US, Federal Reserve has two mandates:
- Price stability
- Maximum sustainable employment
You might ask “well these are great mandates, but how does Federal reserve achieve those?” The answer to such a question is lengthy. I will get into it in future. In a nutshell, Federal Reserve has many tools in its disposal to use to achieve such mandates. Adjusting the interest rate, printing money, quantitate easing are just a few examples of those tools. Of course some of these tools have/are abused through time. I will address those in future as well. Long story short, we have an entity in the U.S that is responsible to achieve above mandates by using some important tools.
Federal Reserve can only use those tools properly if it knows what the inflation rate (among other factors) is. In other words, it can only change what it measures, right? How does Federal reserve measure inflation? This is a difficult question to answer.
- What goods should we take into consideration when we calculate the inflation?
- What regions should be considered in our calculation?
- What time frame?
- The quality of life usually increases over time, how do we take that into account when we calculate the inflation?
Simple questions usually do not have straightforward answers. Thankfully, we have an organization in the U.S. to answer (some) of these questions and to measure just that. U.S. Bureau of Labor Statistics is responsible to take these questions (and many more) into account and to measure (and report) the inflation on a regular basis. U.S. Bureau of Labor Statistics uses CPI to measure inflation. The Consumer Price Index (CPI) is a measure of the average change over time in the prices paid by urban consumers for a market basket of consumer goods and services. Indexes are available for the U.S. and various geographic areas.
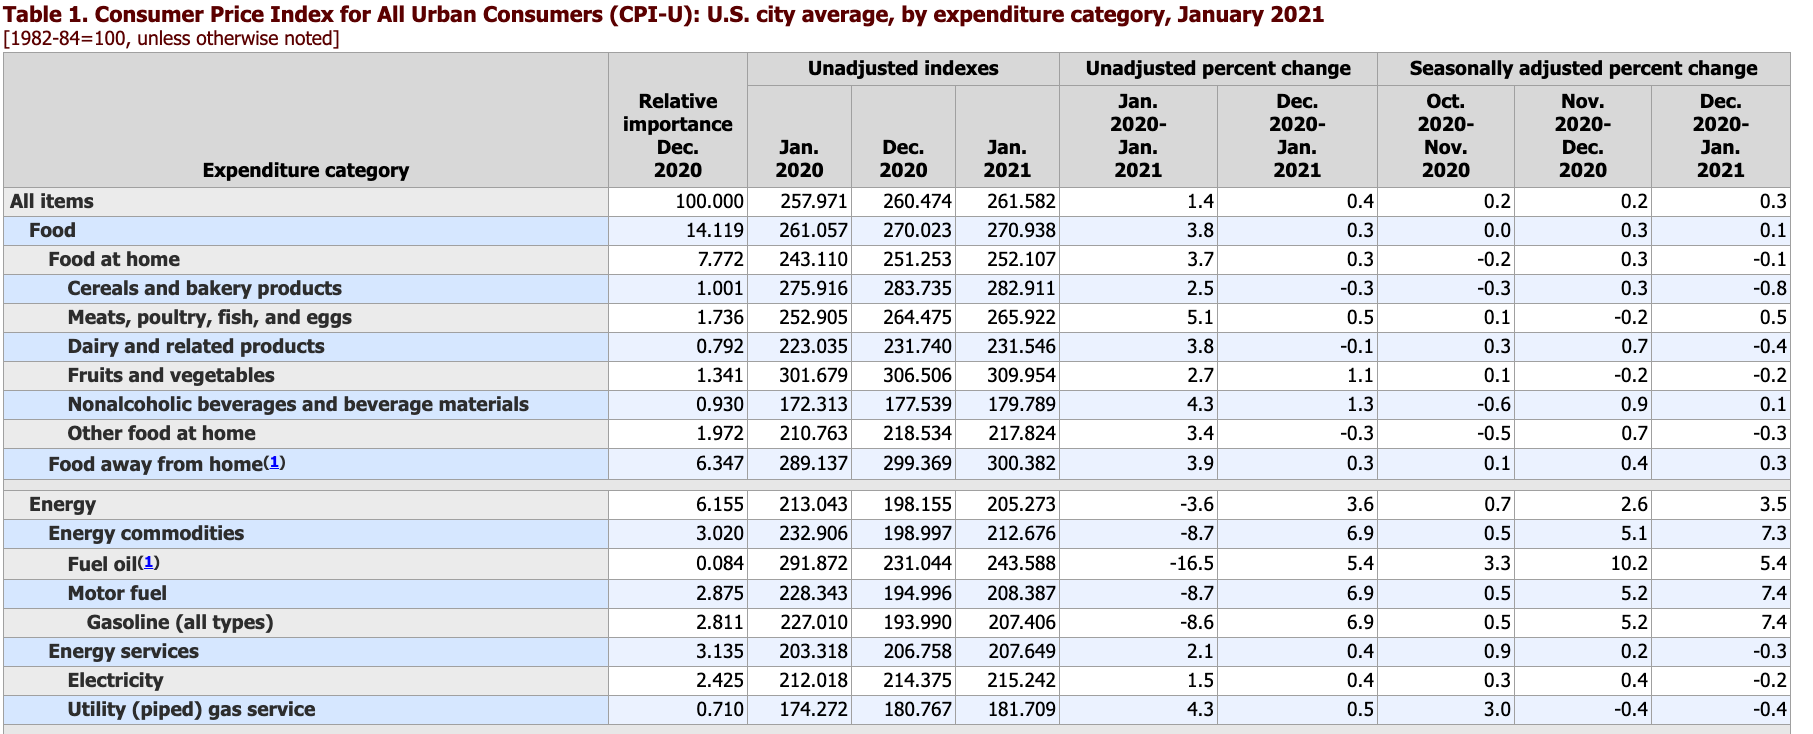
Figure 1 shows the sample of what U.S. Bureau of Labor Statistics report. For example, “food at home” CPI was 243.110 in Jan 2020 and it is 252.107 in Jan 2021. The percentage change is about 3.7%. The Bureau then combine all the percentages (some sort of weighted average) to come up with one number. That number is the inflation rate reported through mainstream media. Wait, what?? I know, I know,… the devil is in details. Just bare with me to explain the flaws in these types of aggregation.
There is a level of subjectivity
How does Bureau come up with the categories? For example, food is a broad category. Here we are representing it with 6-7 sub categories. That itself introduces some levels of subjectivity. Bureau uses different surveys, research etc. to create a basket of goods, but still there are some levels of subjectivity at the end of the day. Be careful when you go through their reports.
Average might not be a good statistics
Average is prone to outliers and might not be a good statistics to use. Due to variance in price of goods and services based on their characteristics, it is wise to look at other statistics such as Median, and percentiles. With average, the story is summarized in one word and one-word story is almost always misleading.
Whenever you aggregate, you scarify something
No matter how delicate Bureau carries out the calculation, the aggregation could be very misleading. For example, if people in the US mostly eat Beef and Beef has been weighted heavily in the calculation, the final number will be influenced by beef more than let’s say chicken. Again, no matter how you weight the items, as soon as you aggregate the numbers, you are dealing with average inflation. If you eat chicken a lot, the number represented here might not reflect how much your wallet is affected by inflation. Another level of aggregation occurs among categories. For example, food and energy must be weighted somehow. If you are heavy energy user, but you do not eat much food (which I do not recommend), the inflation rate reported might not be applicable to you.
Price depends on the region
Another flaw of these types of reports is that the numbers are averaged among regions throughout the country. Sure, Bureau publishes reports for each region, but when the inflation is reported, it is only one number. This means that you might suffer from inflation heavily, and I might suffer from it mildly, but on average, the inflation is modest!
Price depends on sub regions
Even when you look at one particular region, let’s say Dallas metroplex (DFW), there is so much variance within DFW itself. For example, there are pockets of neighborhoods that might be affected heavily by inflation and other pockets not much.
In times of shock, inflation increases more asymmetrically
Whenever some shocks such as 2008 meltdown, 2000 tech bobble, 2020 pandemic, etc. happens, Federal Reserve uses its tools to stimulate the growth. It usually drops the interest rate, prints money and uses quantitative easing. The result is growth in liquidity (cheap cash) which in fact results in high inflation. The inflation introduced during those times are usually a lot higher than the 2% target and are extremely asymmetric. For example, asset prices rise so much during those times while other goods and services lag behind. Since Federal Reserve is mainly interested in average inflation rate, it pulls back late once asset prices are inflated so much.
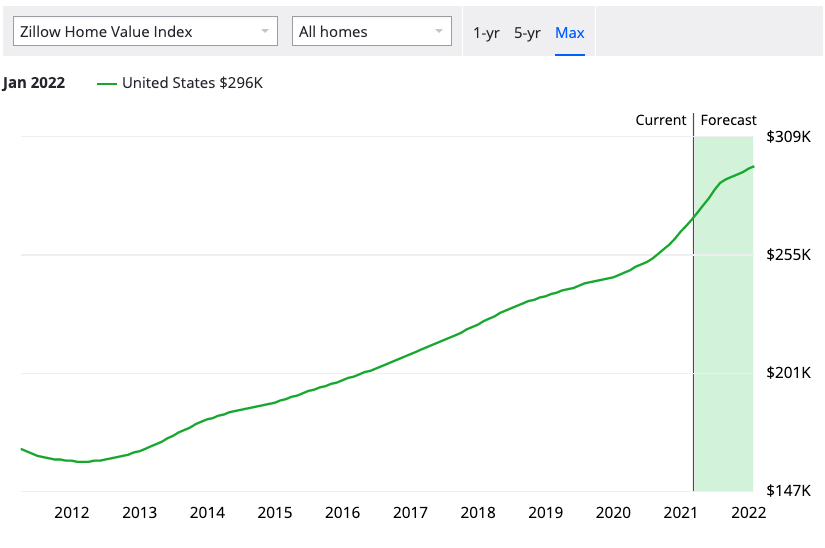
There are, of course, more issues with the way the numbers are reported and interpreted. But I hope you get the gist of what I am trying to convey here. The number that Federal Reserve is targeting (2% inflation, recently changed to average 2%) might not do any good to you. To calculate that important number, Statisticians average/aggregate the underlying prices a lot. To the extend that it is probably not applicable to you. If you are planning your retirement, planning to buy a house, planning to buy a car etc. you should really think twice before relying on the reports. I will leave you with figure 2, housing prices in the US since 2012. What is the inflation rate? Has Federal Reserve hit its target?
Bottom line
I analyze, slice and dice data daily. At the same time, I am extremely careful about the limitation of data and the danger of letting it fool me. Inflation is real and it is a lot higher than what reports say. Bureau is doing its best to capture average price movement. There is so much variance in prices depending on regions, sub-regions, your style of living and many more factors. Just remember that what you hear in the news is just one number. Stories that are told with one word are not complete!
Until next time.